

Once we establish that global warming is actually occurring, we next must identify potential causes of climate change and determine if human factors are significant contributors.
However, this is by no means an easy question to answer. The Earth's climate is a very complex system, that reacts in a variety of ways over different timescales, that is only just beginning to be understood. Establishing cause and effect relationships is difficult. There are many factors that can affect the climate, both "internal" such as climate variability, and "external", such as solar cycles.
Here we will briefly examine several potential causes of climate change and discuss the amount of influence each is currently estimated to have on the climate.
The Earth's orbit around the Sun is not perfectly circular, but slightly elliptical. The shape of the orbit itself also varies slowly over time. These slight variations lead to changes in the distribution and abundance of sunlight reaching the Earth's surface. Such orbital variations, known as Milankovitch cycles, are a highly predictable consequence of basic physics due to the mutual interactions of the Earth, its moon and the other planets.
There are a number of important types of orbital variation:
Each of these changes affect the amount or distribution of sunlight over the Earth. As sunlight provides the energy that drives the climate, these variations obviously also affect the climate. For more detail see Milankovitch cycles.
These slow variations are now generally agreed to cause the cycling between ice ages and warm interglacial periods. But, as these cycles are so slow, thousands of years are needed to significantly change the climate. The recent warming has occurred far too rapidly and so must be due to some other cause.
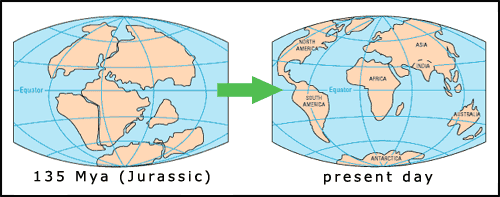
These are the processes that control the distribution of continents over the Earth's surface, as well as causing earthquakes, volcanoes, and mountain range formation. These processes are continually occurring, although at a slow pace. Tectonics (continental drift) can affect the climate. For example, if continents move towards the equator, snow cover will be reduced. This leads to less sunlight being reflected and a warmer climate. Or the creation of mountains formed by continental collision, as is happening now in the Himalayas, can increase rainfall. This rain reacts with exposed rock, absorbing atmospheric CO2 and slowly cooling the climate. Figure 1 shows continental positions 135 million years ago and today.

Could tectonics account for the recent rapid warming of the Earth's climate? Again, these processes are too slow, and are capable of changing the climate over millions of years, rather than over one century.
A single eruption, of the kind that occurs several times per century, can impact climate. The dust thrown into the atmosphere can cause cooling for a period of a few years. But even the eruption of Mount Pinatubo in 1991 is barely visible on the global temperature profile. Climatic effects from volcanic eruptions are relatively short lived, as within a few years the dust settles. Volcanism can also be safely ruled out as a cause of global warming.
Sunlight provides nearly all of the energy driving the Earth's climate, so any change in the Sun's output will obviously have some effect on our climate. As previously mentioned, orbital variations and volcanism affect the climate by changing the amount of sunlight reaching different parts of the planet's surface. There is also variation in the power output of the Sun over time. Many possible solar cycles have been suggested, but only the 11 and 22 year cycles are clear in the observations:
The variation in solar irradiance during recent cycles has been about 0.1%. Researchers have correlated solar variation with changes in the Earth's average temperature and climate - sometimes finding an effect and sometimes not. The most recent IPCC view is that influence on the climate from solar variations is around one fifth that from greenhouse gases.
A recent study and review of existing literature also suggests that the evidence is solidly on the side of solar brightness having relatively little effect on global climate, and downplays the likelihood of significant shifts in solar output over long periods of time (Foukal et al 2006 and Terradaily 2006). The consensus amongst climate scientists is that solar variability could have been an important driver of climate warming until the mid 20th century, but since then the warming has been far too rapid to be significantly accounted for by this.
So far, we have been discussing so-called "external" variability (also called "forcing"), that causes the Earth's climate to change. But the climate is so complex that it can change even without external factors altering. A well known internal variation is the El Niño Southern Oscillation, that involves the movement of vast amounts of warm water across different parts of the Pacific ocean, over a period of several years. The build-up of warmer water in turn leads to increased rainfall and the release of energy from the oceanic reservoir that results in a slight increase in the average global temperature. The opposite phase of the oscillation, El Niña, leads to opposite effects.
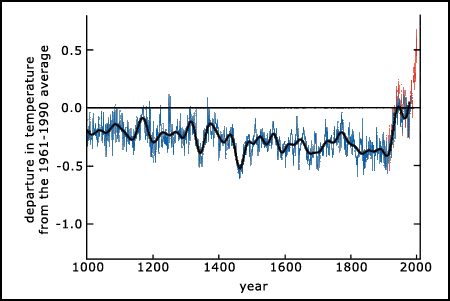
Could such internal variability have caused the warming over the last century? By examining the proxy climate data for the last 1000 years climatologists have determined the natural variability in climate over recent centuries, before mankind began to have a large-scale impact on the planet. Between the years 1000 and 1800 the record shows no magnitude of warming similar to that seen in the last century or so (figure 2).

By the use of General Circulation Models (computer simulations of the climate), various factors can be changed to determine which have more effect. When climate models are run with only internal variability and those other factors discussed above, the modeled global average temperatures are very similar to those found in the proxy data prior to 1850. There must be some other factor that is causing the recent rapid climate changes.
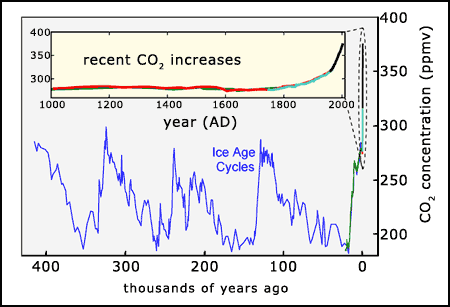
As we previously discussed, without greenhouse gases the Earth would be considerably colder. Adding carbon dioxide (CO2) or methane (CH4) to Earth's atmosphere, with no other changes, will make the planet's surface warmer. Have greenhouse gas concentrations in the atmosphere been increasing? As shown in figure 3, CO2 levels over the last 400,000 years have cycled relatively predictably in line with ice ages. But over the last 200 years CO2 levels have increased dramatically, from around 280 ppm (parts per million) to more than 370 ppm today. These increases are projected to reach more than 560 ppm before the end of the 21st century.

Adding CO2 or methane to the Earth's atmosphere will result in warmer surface temperatures on Earth, without any mitigating actions or effects. Therefore any debate must be about what the net effect of the addition of greenhouse gases will be, when allowing for compounding or mitigating factors.
But straightforward emissions from human activities are not the only contributers to global warming. All over the Earth forests act as major carbon sinks that absorb and store CO2 from the atmosphere. The largescale destruction of forests releases this CO2 back into the atmosphere. About 10 to 30% of CO2 emissions are estimated to be due to land use changes (IPCC 2001a).
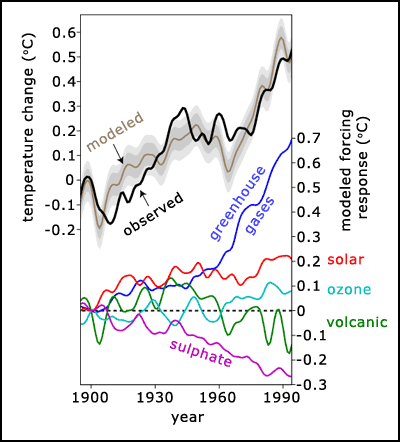
When the human factors are added into climate computer models the results usually match reality very closely. The IPCC consensus is that most of the observed warming over the last 50 years is likely to have been due to the increase in greenhouse gas concentrations, where "likely" is quantified as 66-90% certain (figure 4).

In 2001 the U.S. National Academy of Sciences released a report supporting the IPCC's conclusions regarding the causes of recent climate change. It stated: "Greenhouse gases are accumulating in Earth's atmosphere as a result of human activities, causing surface air temperatures and subsurface ocean temperatures to rise. Temperatures are, in fact, rising. The changes observed over the last several decades are likely mostly due to human activities, but we cannot rule out that some significant part of these changes are also a reflection of natural variability".
A range of factors, both external (forcing) and internal variability affect the Earth's climate. As shown in figure 4, these have both positive and negative effects on global average temperature. The vast majority of climate scientists and climate computer models have agreed that the greatest contributer to climate change, over the past 50 years, has been human activities, principly the emission of greenhouse gases, mostly from burning fossil fuels and biomass.
In the next page (climate change 3) we will examine the possible extent and potential results of global warming.
