


This page gives you an overview of the energy consumption by the human race (excluding food). We describe current energy use, then the predicted energy demand to the year 2030. The expected effects on carbon emissions are also described.
The total primary energy consumption of the human race from 1994 to 2004 is shown in figure 1. This covers the major energy sources such as fossil fuels (petroleum, natural gas, coal), as well as nuclear and hydroelectric. The contributions from geothermal, solar, wind and wood/waste (GSWW) are grouped together in the calculations. There has been a 19.1% increase in energy consumption from 1994 to 2004. The US Dept of Energy Information Administration provided the data used in these calculations and the projections of energy demand.
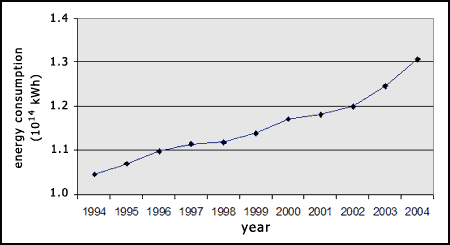
Figure 2 shows world primary energy consumption in 1994 and 2004 sorted by fuel type. The fossil fuels accounted for 87% of the energy used and their use increased by around 25% during this period. The consumption of all of the energy types grew significantly in the period, with GSWW growing by an amazing 88.4%, but GSWW still only makes up around 1% of the total.
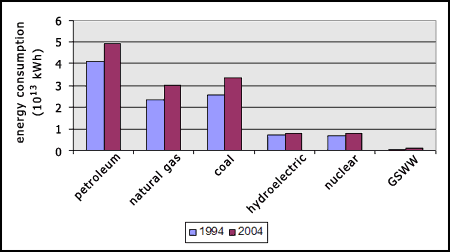
Figure 3 shows world primary energy consumption in 1994 and 2004 per capita, sorted by region. It is clear that North America has by far the largest energy use per capita compared with other regions, but as shown in figure 4 while N. America had almost no growth in energy consumption (0.7%), the growth in other regions was rather large. For instance Asia/Oceania energy use grew by 33.7%. Figure 3 implies that there are still many decades before Asia catches up, if the growth of 33.7% was to be maintained, BUT the rate of increase is accelerating, and more than doubled from 1994/95 (3.8% increase in energy use per capita between years) to 2003/04 (8.8% increase).
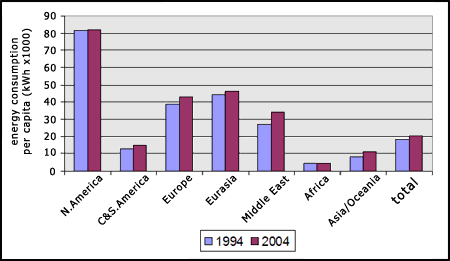
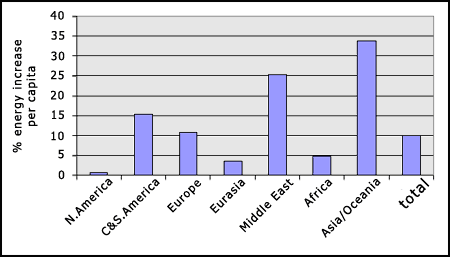
Figure 5 shows the CO2 emissions resulting from the use of fossil fuels in 1994 and 2004. Emissions have increased significantly in all regions (except Eurasia) and especially in Asia/Oceania where they grew by 52.4% between 1994 and 2004.
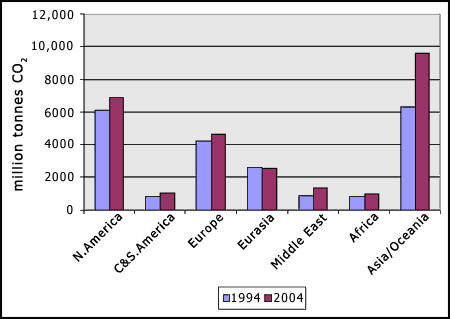
The Asia/Oceania emissions are already the highest of any region, but if the per capita energy consumption of this region catches up with N. America then global CO2 emissions will increase 4-fold (assuming zero population growth and ignoring other factors). Figure 6 shows the recent increases in emissions, with a global average increase of 25% over the 10 years.
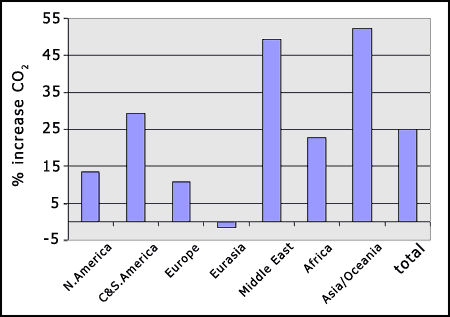
Figure 7 shows projected growth of primary energy consumption, by fuel, from 2003 to 2030, while figure 8 shows the projected increases as percentages. All energy types are expected to show significant growth during this period of 30% (nuclear) to 95% (coal).
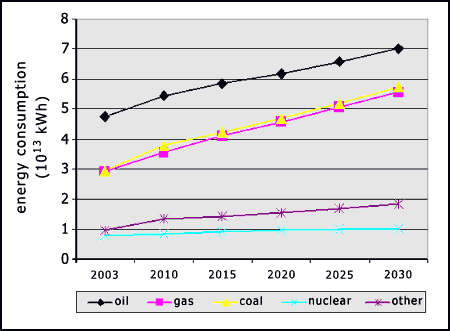
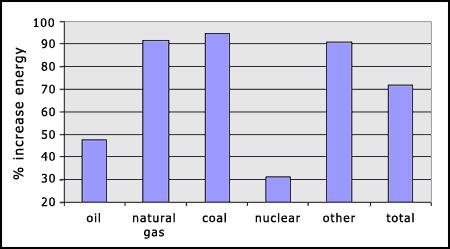
The renewable component is expected to provide around twice the contribution of hydro' by 2030 (data not shown). The renewable energy sources, although increasing by a significant percentage, are still only projected to provide around 7% of the total energy (unless we do something to change this). It is notable that over the same period fossil fuel consumption is projected to increase massively. We can therefore expect that CO2 emissions will also increase substantially.
It is clear from this data that CO2 emissions have increased significantly, and will increase massively over the next decades unless we act now. Taking this energy information together with what we know about global warming (see the climate theory page for more information), we can see that rather than the human race progressing steadily towards severe environmental problems, we are actually accelerating the process.
It seems highly unlikely that the human race will decide to drastically cut its energy consumption below current levels, after all, why shouldn't people in the developing world try to improve their standard of living with electrical goods and motorised vehicles? This being the case, we need to develop and implement radical energy generating solutions, before it's too late. The next page provides an introduction to photosynthesis as a background to our solar energy research project (now ON HOLD).
